Wednesday, June 22, 2016

Imaging Software

Imaging Software Task


Describe what images are needed.

So for this unit Use 6 different images for six different purposes and across a variety of media
For example. Try and incorporate the task into work you are currently doing in your workplace.

You need to be creating six different images, some with Adobe Illustrator so they are vectors, and some with Adobe photoshop so they are raster images.

Here are some examples of what you could include for your six images 


Below is a screen shot for an photoshop file set up
in pixels, RGB for screen, 72dpi.


  • Poster, A5, CMYK, 300dpi. 
  • DLE, leaflet or brochure for print, created in Illustrator, CMYK, 300dpi 
  • A Website image created in photoshop 150 by 150 pixels, RGB and saved as JPEG 
  • Images to be used on social media, Header for a twitter account, or for wordpress 
  • Logo created for a business card, CMYK, 300dpi, and saved as an AI file.
  • Header for a website, RGB 1380 by 72 pixels, created in Photoshop. 


Look at the two diagrams below which should help explain

  • DPI, dots per inch
  • pixel sizes
  • Colour mode, RGB, CMYK
  • Software Illustrator and photoshop.
  •  Raster versus Vector? 


Obtain, input and prepare images to meet needs

Prepare images: Show evidence of sizing, cropping and and positioning of images.


Use screen shots to evidence this


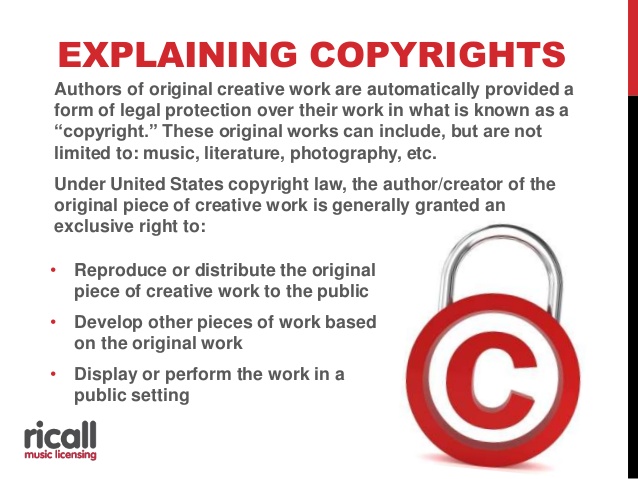
Describe what copyright and other constraints apply to the use of images

Copyright constraints:

• Effect of copyright law (eg on use of other people’s images) Data Protection, Intellectual Property
• Acknowledgement of sources, avoiding plagiarism, permissions


https://www.youtube.com/watch?v=HsTi3vD_Usw


Use appropriate techniques to organise and combine information of different types or from different sources

Combine information: 

• Insert, size, position, wrap, order, group, import data,
 Place command in illustrator of images

• Links and references to external data


Describe the context in which the images will be used.
For example


For a print project like mail shots, Print Poster, Facebook image, Twitter header,
Profile image for Pinterest, Channel Art on Youtube.

Context for images:

• Contexts will vary according to the software and task, for example:

 On screen display, publishing on a web site, hard copy print out, digital file

Describe what file format to use for saving images to suit different presentation methods
File formats for images: 

Find out what the formats mean and where can they be used?


• Will vary according to the content, for example:

  •  jpg for Internet photo display
  •  png for Internet drawing display
  •  svg for graphic designs (the ISO standard most likely to be fully supported by web browsers)
  •  Digital picture format (e.g. jpeg and psd)
  •  Bitmap or raster picture formats (eg raw bitmaps, bmp and compressed formats jpeg and png)
  •  Vector graphics (eg svg, wmf, eps, ai)
  •  Open formats (eg html, odf, pdf and rtf)
  •  Proprietary formats (eg pub and qxd)
  •  Method of compression (lossy, non-lossy)

Lossless and lossy compression are terms that describe whether or not,
in the compression of a file, all original data can be recovered when
the file is uncompressed. With lossless compression, every single bit of data
that was originally in the file remains after the file is uncompressed.
All of the information is completely restored. This is generally the technique of choice for text or spreadsheet files, where losing words or financial data could pose a problem.

The Graphics Interchange File (GIF) is an image format used on the Web that provides lossless compression.


On the other hand, lossy compression reduces a file by permanently eliminating
certain information, especially redundant information.
When the file is uncompressed, only a part of the original information is still there
 (although the user may not notice it).
 Lossy compression is generally used for video and sound,
 where a certain amount of information loss will not be detected by most users.
 The JPEG image file, commonly used for photographs and other complex still images
 on the Web, is an image that has lossy compression. Using JPEG compression,
 the creator can decide how much loss to introduce and make a trade-off between file
 size and image quality.


Bit depth – the information stored in an image. The higher the bit depth of an image,
the more colours it can store.
Bitmapped file – A bitmap is a map of dots or bits that make up an image.
Compression – when data is reduced to make a smaller file.
This may mean loss or data or reduction in quality.
Dithering – creating an illusion if new colours by varying the pixels on a bitmap image
or on a printed images (eg. newspapers)
Lossy – when certain file formats create a loss of data and quality from the
original image to make the file size smaller
Lossless – when the file size is reduced but no loss in quality or data occurs by rewriting the data
Metafile – The metafiles define objects and images using a list of ordinates.
They are mostly used in vector images.
Palette – a range of colours selected by a designer to use in a project.
Pixel – Short for Picture Element – small dots that make up a computer screen display.
Most computers or TVs contain many thousands or even millions of pixels.
Each pixel can only be one colour at a time.
Pixels are so small that they often blend together to make various shades and blends
of colours.
Raster – an image made up from a grid of pixels/bitmap.
This means when a raster image is enlarged it will loose it’s quality and
Vector – an image made up from points that when the image is scaled up or down
the image uses an algorithm to forma new image without losing quality


Store and retrieve files effectively, in line with local guidelines and conventions where available.
Store and retrieve:

• Files (eg create, name, open, save, save as, print, close, find, share), file size

• Version control

• Import data, export data

• Folders (eg create, name)


Use Screen shots to help evidence this unit.

Here are some info graphics to help with this unit


Tuesday, June 21, 2016

Getting Started with Facebook and Google Analytics

Getting Started with Facebook and Google Analytics

When you run a social media campaign on Facebook or any other social network it’s important that you can gauge how successful they are and how they affect relevant KPIs (Key Performance Indicators). This post will cover the basics of using Google Analytics to see the impact your social media efforts are having on your traffic, on-site activity and conversion goals.

What is Google Analytics and why use it?

If you currently don’t have any kind of analytics installed on your website, stop what you’re doing and go set up a Google Analytics account right now! Google Analytics will give you a wealth of data about how often and in what ways your website is used. It’s vital to be able to spot trends and have any idea if your marketing efforts are actually working.
There are plenty of other perfectly good analytics solutions out there, but as Google Analytics is free and a seriously robust solution, I would highly recommend it. According to Wikipedia, Google Analytics is currently used on around 50% of the world’s top 1,000,000 websites, which is no mean feat.

Which KPIs matter?

This could vary for different business types but in almost all cases the following KPIs will be the ones to watch:
    • Acquisitions, or referral traffic This is the number of users who come to your site via a specific channel, e.g. Facebook.
    • Goal conversion rate / Ecommerce conversion rate for Ecommerce sites This is the percentage of referred users who complete a goal or transaction on your site.
Arguably these are the most important KPIs; the first increases your traffic, brand awareness and potential to engage your users, the second is what affects your turnover. By working to improve both of these KPIs you will ensure your site is busy and good at converting users into customers.

How do I see Facebook referral traffic in Google Analytics?

Step 1. Once you have your tracking set up you just need to log in to your Google Analytics account and click on the reporting tab; this is where you will see all the data for your website. Clicking on the Acquisitions tab will show the available sub options, you should now click Channels. You will notice that Google have kindly grouped your channels into 5 main types: Organic, Direct, Paid Search, Referral and Social. Were only interested in the Social traffic, so click through to break the data down further.
You’ll now be able to see the number of visits you’ve had from Facebook in your selected date range by looking at the Visits column. On the right hand side above this table you can choose to display the data as a pie chart, this gives you a useful insight into how Facebook stands up against other social network traffic.

If you now click through on Facebook youll be able to see how that data breaks down on a daily basis for your date range. This is a really great way to see what kind of impact any marketing efforts may have had. If for example you run a competition on your page and just afterwards you see a spike in visits from Facebook, you now know competitions resonate well with your audience.

How do I see conversion rates for my Facebook traffic?

You now know how much traffic you get from Facebook, but the real question is how that traffic translates into conversions. A conversion could be anything from a user sending an enquiry to purchasing a product, or even both.
For this to work you will need to have some goals set up in Google Analytics, or you will need to turn on the Ecommerce settings and install the relevant tracking code on your website conversion page. To get started, set up a simple goal, something like “Customer enquiry”. It’s always a good idea to run a test afterwards to make sure your goal gets logged. I would recommend waiting up to 24 hours before you decide whether it has worked or not, as Google Analytics can take some time to update.
Once that’s set up, you can now follow Step 1 from the previous section (Acquisition > Channels > Social > Facebook) which should now also be displaying your conversion data. Using the Conversions drop down you can choose to show all goals or just one at a time. I’d recommend one at a time so as not to skew your data. You can now see your conversion rate, number of conversions and any associated values (particularly useful for Ecommerce tracking).
The most useful number here is your conversion rate – by comparing this to other channels you can start to see how well your Facebook users convert into paying customers and if your fans have the right profile to be really valuable to you.

How can I use this information?

This information is vital to tell you how well your page is performing in terms of driving the right users to your site. Every time you do a marketing campaign on Facebook or post something that gets a lot of likes and shares you should be checking to see the impact it has on your traffic and conversions. By following this process you can quickly start to identify which sort of campaigns and messages work well for your business.

http://www.socialmediaexaminer.com/google-analytics-basics/
https://support.google.com/analytics/answer/1008015?hl=en

Use digital and social media in marketing campaigns

Use digital and social media in marketing campaigns

What are the best social media marketing campaigns of all time?


What are the best social media marketing campaigns of all time?


…to this…


Old Spice man


In July 2010, Old Spice made custom videos where Isaiah Mustapha would address individual Twitter users, one-to-one.
https://www.youtube.com/watch?v=0Cs95FmimP0&feature=player_embedded

This social campaign followed the hugely successful Super Bowl TV commercial of February 2010 and further follow-up ads, which were also very popular on YouTube.
187 videos were created for the Twitter campaign and brought in 11m views, and over 22,000 comments in three days.
In a debate that was raging back in 2010, many questioned whether
such sharing would result in sales uplift.
However, despite an initial decline in sales of body wash, once the momentum from the advertising hit sales, numbers did increase significantly with numbers somewhere around 8% for year-on-year increase.


The campaign cost $11.4m in total and generated 1bn media impressions.
Taking such a popular TV ad on to social media and personalising it for some users was pretty new back in 2010. Although YouTube was well established in 2010, Twitter was still climbing, from 100m users at the start of the year to 190m in June 2010.

This campaign makes the list because it shows the reality of success on social is about engaging and, often, funny content that users are happy to consume. The campaign marked a departure for the brand and one that was ultimately successful.


Obama’s 2008 and 2012 presidential campaigns


In 2008, Obama’s team deserved credit for simply earmarking social media as a place that politicians, especially campaigning politicians, need to be.
By the time the 2012 election rolled around, of course, Obama would always be starting with an advantage across social networks, when compared with Mitt Romney.

It’s unsurprising that come 2012, a lot of sentiment, even for Obama, was negative on social media. A re-election campaign doesn’t have the same lustre, and by this time the bad side of politics had made it to social media, too.

Dan Weingrod looked at some of the parts of the
2012 social media election campaign to be admired.
Bringing the technology in-house

The campaign technology team was in-house instead of outsourced. A custom technology platform was developed that could iterate and meet the needs of the campaign.


Effective use of data


Integrating disparate data sets mirrors the joining of ecommerce multichannel data. This data helped OFA determine which social media platforms to use to target demographics perhaps previously ignored.

Most importantly a culture of A/B testing discovered the best media platforms, headlines, images and even the best minimum contribution level ($14) for emails.

Creating a social media infrastructure


On the infrastructure side OFA rolled out Dashboard, a tool which changed the way the team interacted with its volunteers.


Dashboard “socialized” the volunteer experience by using data to help volunteers focus on likely voters rather than lost causes.


Dashboard created more positive experiences for volunteers by driving more positive results. The result was a get-out-the-vote effort that surpassed all expectations.


In 2012 Obama had a
57% share of voice over Romney and took part in a successful AMA (ask me anything) session on Reddit. Throughout 2011 and 2012, Obama had also engaged in occasional town hall meetings on Twitter, answering user questions.


For anyone thinking these two election campaigns weren’t extraordinary in terms of social media usage, see
Minter Dial’s teardown of social media use (or non-use) in the French presidential election of 2012.
GoPro's video of the day


GoPro obviously has a particularly engaged customer base when it comes to content creation, as luckily enough that's what the GoPro products are designed to do.


However, GoPro shares video extraordinarily well, with the following example perhaps the most famous. Good content gets shared and GoPro's video of the day on Facebook has helped the page rack up over 7m likes.

https://www.youtube.com/watch?v=CjB_oVeq8Lo&feature=player_embedded


Oreo’s agility


Oreo features here for
its entire activity rather than one campaign, though its agile marketing during Super Bowl 2013 is certainly the pick of the bunch.


Oreo’s activity shows how simple yet effective that reactive or agile marketing can be when combined with social media. The sharing of Oreo’s content is impressive for a cookie that hasn’t changed for many years.


In a sector like FMCG, this level of sharing and earned media effectively saves Oreo some ATL budget and generates brand awareness with effective scale.


For the PS4 launch:


For its Daily Twist campaign on the 100th anniversary of Oreo:


For the Super Bowl powercut:


Cancer Research UK: #nomakeupselfie


In March 2014 Facebook users, but also Instagram and Twitter users, were taking selfies with no makeup on then nominating other people to do the same. This was intended to raise awareness of and money to fight cancer.


Whilst this didn’t start as a campaign for Cancer Research UK, its team was agile enough to react in real-time and jump on to the trend. The charity answered questions asked by many of the public and encouraged engagement through its own channels. However, in the main, this was an example of great reactive and common sense marketing.
See this post for more detail on how the social media team made the most of the phenomenal activity around the hashtag.


This campaign makes the list because it demonstrates (and made the most of) mobile and social media as newly integral to fundraising efforts.


The majority of the donations were given via mobile, by text message, and the content and imagery was mainly consumed on smartphones.


Cancer Research UK received donations of £8m in just a couple of weeks.
View image on Twitter


Ikea's Facebook showroom


I’ve included this campaign precisely because it broke Facebook’s rules.
https://www.youtube.com/watch?v=0TYy_3786bo&feature=player_embedded

Ikea in the spirit of guerrilla marketing used picture tagging to run a competition designed to promote its new store in Malmo in Autumn 2009.


The campaign didn’t cost much, and technically contravened Facebook’s rule that businesses must use only apps within Facebook to run competitions and not organic posts.


12 pictures of the store’s showrooms were uploaded over a fortnight and users could win the products on show by being the first person to tag their name on it.


To me this campaign shows how if marketers understand the nature of social media, they can ‘jack’ it on lower budgets than traditional media. All it takes is a little creativity.


Innocent Drinks' Tweet And Eat Cheap


The ‘Tweet & Eat Cheap’ campaign was designed to promote Innocent veg pots.


The discount on offer increased with the number of people who tweeted the hashtag #tweetandeat.


The competition also ran on Facebook.


This campaign might be fairly modest but I’ve included it because of its simplicity. Mass action will result in mass gain. Audiences will unite on social media if it’s for the good of the group, even if it’s only a free pot of vegetables.


The results of the campaign show that simply being prepared to give away something for free can be the only bold step a brand needs take.


18,000 tweets reached over 5m people. Awareness increased by a considerable 11% amongst the target audience.


Customer base effectively doubled, with 31% of Innocents audience having bought a veg pot, compared to 16% prior to the campaign.
Kern and Sohn Precision Scales


Kern is included for demonstrating what an effect social signals and content sharing can have on search marketing.


Kern wanted to grow their reputation and revenue in the education and laboratory sectors.


The idea is explained in the following video. Earth’s gravity actually varies, so we weigh slightly more or less wherever you go. Kern wanted to send a gnome around the globe in a flight case with a set of its scale to test this hypothesis.


The hosts of the gnome in each city would add data to gnomeexperiment.com.


The gnome was photographed with many landmarks and even made it to the South Pole.
Within two days the story had reached an audience of over 355m in 152 countries.
16,386 websites linked to GnomeExperiment.com
Kern was pushed to page one on Google for ‘precision scales’ in all five key markets (up from an average of page 12), resulting in a 21% sales uplift and a 1042% ROI.


Describe the importance of the objectives and budget for digital and social media marketing aligning with the marketing plan


Six key questions to answer in your social media strategy


Assuming that you're clear on what you need from social media in terms of goals and objectives, there is often a key missing ingredient from a social media initiative - a fully considered strategy. It sounds a little glib, and yet it remains important to be clear on the how and why of implementing and integrating social media marketing into the business.


There are multiple benefits to getting this right:
Get buy in from budget holder, project sponsors and senior management
Clarity on vision, purpose and direction with business context
Ability to scale both the size and scope of the social media programme
Budgeting and resource management against objectives and goals, to understand the return against any other marketing activity


I find that strategy is generally misunderstood, and it appears that this is even more the case in social media where focus is so often about the goals (I want 10,000 Facebook Likes) or the tools and tactics (we need a Facebook Fan page).


Strategy is neither goal based, tactical, about timings or the plan itself. A strategy is what's needed to achieve the goals, the road-map, not the destination.


“All men can see the tactics whereby I conquer, what none can see is the strategy out of which victory is evolved.” – Sun Tzu, The Art of War.


This issue is a marketing wide problem, probably business wide. We certainly have seen the same issues within siloed tactics like search engine marketing, PR, email and display advertising all running individually from any communications strategy. I appreciate that this maybe getting a little marketing textbook, yet a social media strategy desperately needs a wider operational context, it must be aligned with the business strategy and the subsequent communications strategy. Identifying and tying the social media strategy right back to the business strategy is therefore fundamental those 4 bullet points above too, of course. Strategic alignment immediately informs the perspective of the person creating the social media strategy saving a lot of pain further down the line.
Ensuring strategic alignment?


If you want your social media marketing processes and campaigns to deliver something of value back to the business then you need to align with the business. Forgetting the tactical, ad-hoc approach to social media ("We need a Facebook fan page") which is where most businesses currently are, there are two common strategic approaches that we see:
Social media marketing. Whereby you're most often reacting to the need to be using social media but nonetheless are integrating into a wider communications strategy. Reasonably advanced companies are in this space and it's where companies investing in the future are very quickly headed. Typically this is where there's a focus still on "campaigns" focus and how social media marketing can be integrated as a part of that, the listening and conversation is there with the consumers though the purpose remains promotional or at least very marketing orientated. The social tools and techniques have a purpose within the campaign context. Old Spice guy typifies this for me, it's great, hugely successful and yet it still remains campaign orientated. Tools like Buddy Media for Facebook, and Hootsuite for Twitter in particular have made social campaigns easier to execute for smaller brands, teams and organisations.
Integrated social CRM. several big brands seem to be getting really serious in this area, the focus is way beyond marketing and about the consumer and wider market interactions pre, during and post purchase. The case studies that we read about around Dell and Gatorade and their command centres, for example. Stuff of social media marketing dreams! Where the business is so customer oriented and leveraging social media to engage and interact with the consumer, marketing is but one component in meeting the consumer needs. It's right-side-up marketing done via social media tools, what does the consumer need over what do we want to say.
Key questions to be answered in your social media marketing strategy


Focussing on the marketing strategy, the reality for 99% of businesses, is that there are a handful of questions that are needed to tighten the strategy, and for the sake of this post I'm borrowing a lot from Jay Baer here who I think does a great job on explaining it so succinctly, he pushes us to ask the questions around people first, not abstract concepts, tactics or tools:
Is your strategy about brand awareness, customer engagement or sales? It can only be one of them in reality, otherwise it's two strategies, two strategies is fine so long as you realise and resource for that - most of us are not in that space.
What is your relationship with your intended audience? Jay suggests picking 2 adjacent audience types on this scale: Nothing > Aware of you, but never acted > Acted once > Repeat actions/enthusiasts > Advocates. The value in this question is significant in its simplicity I feel in how it informs your approach to marketing, especially when combined with the next point...
How does your audience typically engage in social media? Using the Forrester Social Technographics Ladder, understand how your target audience (as defined by gender, age, and geography) uses social media. Some audience types are not creative and simply want to consume and share content.
What's your purpose? Jay Baer calls this your "one thing", Joe Pullizzi (from a content marketing perspective) talks about the intersection between you and your audience.
How will you be human? Easier for smaller businesses, harder for larger businesses.
How will you manage social media? Think not only return on investment and KPI's, but
governance and roles and responsibilities, easier again in smaller businesses where there's far less hierarchy and politics.

Describe how to identify the nature and location of target customers

Why identifying your target audience matters


If you know…


who the people are, you know how to get to them (the blogs they read, the sites they visit, the stuff they search in Google etc)
how they describe the type of services they offer, you can word the copy on your site to match the conversation in their head (very important!)
how they choose and compare products in your category, you know how to structure and prioritize content on your site
what they want, your value proposition can state exactly that and the whole site can be 98% relevant to them
what they don’t care about, you can dismiss and cut it from the site
how their life is better thanks to your service, you know which end-benefits to communicate


How to Identify a Target Market and Prepare a Customer Profile


Get your message to the people who need and want what you have to offer! This guide takes you through a step-by-step process that helps you identify specific target markets within your industry and provides you with the know-how to create customer profiles to better channel your marketing efforts


Get your message to the people who need and want what you have to offer! This guide takes you through a step-by-step process that helps you identify specific target markets within your industry and provides you with the know-how to create customer profiles to better channel your marketing efforts

WHAT TO EXPECT

This Business Builder will take you through a step-by-step process that will help you identify specific target markets within your industry and provide you with the know-how to create a customer profile.
WHAT YOU SHOULD KNOW BEFORE GETTING STARTED

In order to market your product or service, it is imperative that you tailor your marketing and sales efforts to specifically reach the segment of population that will most likely buy your product or service. It is critical that you first determine or clearly identify your primary market. Your energies and funds then can be spent more efficiently.


If you don’t know who your customers are, how will you be able to assess whether you are meeting their needs? Since success depends on your being able to meet customers’ needs and desires, you must know who your customers are, what they want, where they live and what they can afford.

We’ve all heard a business owner say, "My product is terrific! It appeals to everyone." Many of us have also seen small businesses that try to be all things to all people. This is a difficult, if not impossible, bridge to cross.

Targeting your market is simply defining who your primary customer will be. The market should be measurable, sufficiently large and reachable.


Once your target market is defined through your knowledge of product appeals and market analysis, and can be measured, you should determine whether that target market is large enough to sustain your business on an ongoing basis. In addition, your target market needs to be reachable. There must be ways of talking to your target audience.


Types of Markets

A market is simply any group of actual or potential buyers of a product. There are three major types of markets.
The consumer market. Individuals and households who buy goods for their own use or benefit are part of the consumer market. Drug and grocery items are the most common types of consumer products.
The industrial market. Individuals, groups or organizations that purchase your product or service for direct use in producing other products or for use in their day-to-day operations.
The reseller market. Middlemen or intermediaries, such as wholesalers and retailers, who buy finished goods and resell them for a profit.

IDENTIFYING YOUR MARKET


Here are three steps to follow when identifying your market:
Identify Why A Customer Would Want To Buy Your Product/Service
Segment Your Overall Market
Research Your Market


Step One — Identify Why A Customer Would Want To Buy Your Product/Service

The first step in identifying your target market is understanding what your products/services have to offer to a group of people or businesses. To do this, identify your product or service’s features and benefits. A feature is a characteristic of a product/service that automatically comes with it.


For example, if a toothpaste has a stain-removing formula, that’s a feature. The benefit to the customer, however, is whiter teeth.


While features are valuable and can certainly enhance your product, benefits motivate people to buy.


An example is anti-lock brakes; they are features on a car, but the benefit to the consumer is safety.


By knowing what your product/service has to offer and what will make customers buy, you can begin to identify common characteristics of your potential market.


For example, there are many different consumers who desire safety as a benefit when purchasing a car. Rather than targeting everyone in their promotional strategy, a car manufacturer may opt to target a specific group of consumers with similar characteristics, such as families with young children. This is an example of market segmentation.

In one column, list the features of your product/service. In the other, list the benefits each feature yields to the buyer.


Step Two: Segment Your Overall Market


It is a natural instinct to want to target as many people and groups as possible. However, by doing this your promotional strategy will never talk specifically to any one group, and you will most likely turn many potential customers off. Your promotional budget will be much more cost effective if you promote to one type of customer and speak directly to them. This allows you to create a highly focused campaign that will directly meet the needs and desires of a specific group. Again, this is called market segmentation.


Case Study…A president of a management training firm had been marketing to Fortune 500 companies more than a year. She received some business, but the competition was fierce. One day, she received a call from the owner of a manufacturing plant who needed to have managers trained. The president agreed to take the job, and found out there was virtually no competition for plant manufacturing training services, because it was less glamorous to train in a manufacturing plant than in executive offices of theFortune 500 companies. The president decided to change her marketing strategy and target only manufacturing plants. Their promotional material reflected this change. Within six months the company increased its revenues by 80 percent and created a competitive edge by segmenting its market.


Market segmentation is the process of breaking down a larger target market into smaller segments with specific characteristics. Each group requires different promotional strategies and marketing mixes because each group has different wants and needs. Segmentation will help you customize a product/service or other parts of a marketing mix, such as advertising, to reach and meet the specific needs of a narrowly defined customer group.


Case Study… Career Options, a job placement firm, has a target market of the unemployed. While it’s true that anyone looking for a job is a potential customer, developing a focused marketing strategy to reach such a broad market would be difficult, if not impossible.


Instead, Career Options should target the following segments within the broad group of people seeking employment: recent college graduates and professionals in transition. Both groups share one important characteristic — they need a job — but the two groups have different characteristics, different needs and wants. New college graduates, for example, are young and often unsure of career paths. They have little experience in resume writing and interviewing. Professionals in transition may be dealing with the trauma of being fired or laid-off. They usually have a defined set of skills and a career path.

Another example of market segmentation is the athletic shoe industry. Major manufactures of athletic shoes have several segmented markets. One segment is based on gender and the other segment is based on the type of sport or activity. They have different promotional campaigns for each market segment.


Larger markets are most typically divided into smaller target market segments on the basis of geographic, demographic, psychographic and behaviouristic characteristics:
Geographic. Potential customers are in a local, state, regional or national marketplace segment. If you are selling a product such as farm equipment, geographic location will remain a major factor in segmenting your target markets since your customers are located in particular rural areas. Or, if you own a retail store, geographic location of the store is one of the most important considerations.


Climate is a commonly used geographic segmentation variable that affects industries such as heating and air conditioning, sporting equipment, lawn equipment and building materials.

Decide if your business is going to do business on a local, regional, national or international level. Identify the geographic region where your market is located. Identify specific boundaries within which you will do business.
Demographic. Potential customers are identified by criteria such as age, race, religion, gender, income level, family size, occupation, education level and marital status. Choose those characteristics of your demographic target market that relates to the interest, need and ability of the customer to purchase your product or service.


For example, a target market for a real estate developer selling luxury vacation homes near Walt Disney World would include professional married couples approximately 30 to 45 years old with young children, and with incomes of more than $100,000.

Another example of targeting through demographics is Liz Claiborne Apparel Company. They have named their target market, her name is Liz Lady. They know Liz Lady’s age, income range, professional status, family status, hobbies and interests. Every decision from marketing to design is based on Liz Lady’s profile.


A demographic profile for a business would include such factors as customer size, number of employees, type of products, and annual revenue. If you are a business-to-business marketer for example, you may want to consider segmenting according to your target customer’s size. A printing company may decide to target only magazine publishers that publish more than one magazine because they need high volume accounts to make a profit.


Identify the following demographic characteristics of your market.


Consumer Market


Age


Income


Gender


Profession


Education


Family Size


Homeowner


Marital Status


Business Market


Geographic location


Size of Company


Annual revenue


Number of Branches


Number of Employees


Industry


Age of Company

Psychographic. Many businesses offer products based on the attitudes, beliefs and emotions of their target market. The desire for status, enhanced appearance and more money are examples of psychographic variables. They are the factors that influence your customers’ purchasing decision. A seller of luxury items would appeal to an individual’s desire for status symbols.

Business customers, as well as consumers, can be described in psychographic terms. Some companies view themselves as cutting edge or high tech, while others consider themselves socially responsible, stable and strong. Still others see themselves as innovative and creative. These distinctions help in determining how your company is positioned and how you can use the company’s position as a marketing tactic.


For example: Southwest Airlines has positioned itself as an innovative and fun airline that takes passengers on short, inexpensive excursions, whereas Delta chooses to promote reliability and safety.


The following are psychographic variables. Identify the characteristics of your target market.


Consumer Market


Lifestyle


Fun-Seeking


Family Stage


Trendy


Hobbies


Status Seeking


Sports Enthusiasts


Conservative


Forms of Entertainment


Socially Responsible


Publication


Environmentally Conscious


Influencer


Subscriptions


Family Oriented


Technical


Workforce Type


Management Style


Other


Business Market


Business Style


Industry Leader


Business Stage


Innovative


Employee Relations


Conservative


Trade Associations


Socially Responsible


Business Products/Stable


Services Used


Employee Friendly


Publication Subscriptions


Workforce Type


Management Style
Behavioristic. Products and services are purchased for a variety of reasons.


Business owners must determine what those reasons are, such as: brand, loyalty, cost, how frequently and at what time of year customers in a segment use and consume products. It’s important to understand the buying habits and patterns of your customers. Consumers do not rush and buy the first car they see, or the first sofa they sit on. A Fortune 500 company doesn't typically make quick purchasing decisions.


Most businesses use a combination of the above to segment their markets. Demographic and geographic criteria will usually qualify your target markets so you can establish if segment members have enough money to purchase your offering or if they’re in a location that’s accessible to the product. Most businesses then use the psychographic and behaviouristic factors to construct a promotional campaign that will appeal to the target market.


For example, Career Options is limited to the geographic region where their office is situated because their target customers want to work in that area. In their advertising they will appeal to psychographic factors such as the desire for stability and income.


Take a moment to decide which segmentation criteria will be most helpful to you in segmenting your target market:


geographic _____Yes _____No


demographic _____Yes _____No


psychographic _____Yes _____No


behavioristic _____Yes _____No


Next, identify what is important to your customers and rank these on a scale of high, medium, low or not at all. Are they price sensitive? Are they looking for the highest quality? Is great customer service important? Or, is location a deciding factor?


High Medium Low Not at all


Price


Quality


Brand Name


Variety of services


Salespeople


Customer Service


Special Offers


Promotional Campaign


Packaging


Convenience of Use


Convenience of Purchase


Location


Guarantees


Store/Office Decor


Payment Terms


Other


Step Three: Research Your Market


Some or all these reference tools can be found in the reference collection of any public library or college library that supports local business or a business school:

Psycho-graphic Summary: This segment closely associates work with self-esteem. They feel pressure because most have families and comfortable lifestyles to maintain. They are not interested in forging new careers but want stability.


CHOOSE THE SEGMENTED TARGET MARKET(S) YOU WILL SELL TO

After identifying and defining the possible segments within your target market, you must face the critical question of whether it would be profitable and feasible for you to pursue each identified segment, or choose one or two. To make this decision, you must answer the following questions:

What is the financial condition of my firm? If you have limited resources at this time, you may want to direct your marketing efforts to only one segment. A concentrated advertising campaign to reach one market segment is likely to be more effective than a diffuse campaign attempting to reach two.

What segments are my competitors covering? Are they ignoring smaller segments that I can possibly exploit? The printing company previously mentioned may decide to pursue small magazine publishers because there are many competitors currently serving the needs of larger publishers. Or, Career Options may discover that since in their geographic location there are several firms that specialize in helping professionals in transition, they should specialize in the recent college graduate market.

Is the market new to your firm? If so, it may be better for you to concentrate on one segment for now, and expand to others when your initial segment has been successfully penetrated. Developing new markets takes a greater commitment of time, money and energy.

Important Considerations:

Now think about all the characteristics you have identified and start formulating the promotional campaign that will best address this specific target market. Start to formulate a picture or description of your ideal customer. Make sure everything you do, from design, price to marketing, addresses your market.

Identifying Your Market


___ Determine why a customer would want to buy your product/service.


___ Identify your products’/services’ benefits and features.


___ Decide which segmentation criteria will best segment your target market: geographic, demographic, psychographic or behavioural.


___ Segment your market.


___ Divide larger target market segments into smaller segments.


___ Decide if it would be profitable and feasible for you to pursue each segment.

Explain the implications of retention and acquisition programmes as they affect the choice of digital/social media

Measuring the effects of social media in 10 steps


1. TrafficThis is one of the more obvious ways of measuring social media. Remember that quality often beats quantity, though not always (as many CPM-focused publishers will surely testify).


2. InteractionParticipation is a valuable indicator for many publishers (and brands). It says something about the kind of traffic you are attracting. Remember that an engaged customer is a highly valuable one. Interaction can be anything from leaving comments, to participating in support forums, to leaving customer reviews and ratings. It can happen on your website and on other websites. Keep your eyes and ears open!


3. SalesWe at Econsultancy are tracking sales from organic Google referrals and also paid search. It didn’t seem like much of a leap to track other channels, such as Twitter. Try it. Dell did, and discovered that it made $1m from Twitter in 18 months. Blendtec’s ‘Will It Blend?’ campaign on YouTube helped to drive “a five-fold increase in sales”.


4. LeadsSome companies simply cannot process sales online, because their products or services do not allow for it. For example, the automotive industry, which tends to measure the effects of its online ad campaigns by the amount of brochures requests, or test drives booked in (as opposed to car sales, which is, in marketing terms, an altogether more macro effort). B2B operators are in a similar position. If you are a consultant and spend time interacting on LinkedIn Answers then there’s a way of tracking that activity to enquiries about your services. The same applies across the spectrum of social media sites. Choose your weapon, thought leaders.


5. Search marketing The SEO factor cannot be understated. Social media can be far more powerful in this regard than you might initially imagine. For example, a well-placed story / video / image on a site like Digg will generate a lot of traffic and a nice link from Digg itself, but the real win here is that it will generate a lot more interest beyond Digg. Bloggers and major publishers are following Digg’s Upcoming channel to unearth new and interesting stories (Sky News now has a Twitter correspondent). One link and 20,000 referrals from Digg might lead on to 40,000 referrals and 100 links from other sites. The long tail, in action. 100 links means that your page might well wind up being placed highly on Google, resulting in lots of ongoing traffic. Remember too that you can use sites like Twitter and YouTube to claim valuable search rankings on your brand search terms (‘
social search optimisation’).

6. Brand metrics


Word of mouth and the viral factor (inherent in sites like Twitter, Facebook and Digg) can help shift the key brand metrics, both negatively and positively. These include brand favourability, brand awareness, brand recall, propensity to buy, etc. Expensive TV ads are measured in this way, so if these metrics are good enough for TV then they’re surely good enough for the internet? Positive brand associations via social media campaigns can help drive clicks on paid search ads, and responses to other forms of advertising. We know that TV ads boost activity on search engines, resulting in paid search success stories, so I'd bet that social media can do the same.

7. PR

The nature of public relations has changed, forever. The last five years have been largely about the traditional PR folks not really being able to figure out the blogosphere. But if PRs cannot control the bloggers, then how on earth will they handle consumers? The distinct worlds of PR, customer service, and marketing are fusing. Twitter means everybody has a blog these days, and somewhere to shout about things to their friends (and beyond). Social media sites are the biggest echo chambers in the world! In any event, if you can measure PR (beyond adding up column inches and applying a random multiple to the equivalent size on the rate card!), then you can measure social media.


 8. Customer engagement
 

Given the prevalence of choice, and the ease with which consumers can switch from one brand to another, customer engagement is one of the most important of all metrics in today’s business environment. Engagement can take place offline and online, both on your website and on other sites, particularly social media sites.

Customer engagement is key to improving satisfaction and loyalty rates, and revenue.

 By listening to customers, and letting them know that you are listening, you can improve your business, your products, and your levels of service. The alternative is to ignore customers, which sends out a terrible message. Our research found that an engaged customer will recommend your brand, convert more readily and purchase more often.

9. Retention

A positive side effect of increased customer engagement - assuming certain other factors in play work in your favour - is an increase in customer retention. This is going to be a crucial factor in the success of your business in the years to come. Make no bones about it: we are moving into an age of optimisation and retention. Watch your retention rates as you start participating in social media. Over time, all things remaining equal, they should rise. Zappos, which is a case study in how-to-do-Twitter (and active on MySpace, Facebook and Youtube), is closing in on $1bn of sales this year, and
“75% of its orders are from repeat customers”
. Go figure, as they say.

10. Profits

If you can reduce customer churn, and engage customers more often, the result will surely be that you’ll generate more business from your existing customer base (who in turn will recommend your business to their network of friends, family, and social media contacts). This reduces your reliance on vast customer acquisition budgets to maintain or grow profits. It makes for a far more profitable and more efficient organisation. I really hope that more businesses will find a better balance between acquisition and retention, sooner rather than later, from a resourcing standpoint. Too many acquisition strategies appear to be ill-conceived, are not joined up (both in terms of marketing and also operations), and as such are ripe for optimisation. Plug the leaky bucket and you won’t need to turn the tap so hard to top it up. And remember that old adage about it being cheaper to keep existing customers than to seek out new ones.

Explain how to reach target customers in accordance with the plan


Here are five powerful ways to reach your target market online.

 Connect with their social circles

You’ve probably heard the (overplayed) expression that ‘birds of a feather flock together.’ When it comes to online marketing, nothing could hold more true. Social influence is powerful — and social media is social influence amplified. As a marketer, it’s in your best interest to align with the social channels that your customers and prospects are already using.


If they’re on LinkedIn, make sure that you set up an account on that platform — even if you’re not ready to actively participate, you should at least watch and see how your customer community is interacting. Did you find that your target audience has zero presence on Twitter? If so, don’t waste your time — your best strategy is to join discussion channels and conversations where your target market is already active.


Target behaviours through paid channel advertising

Think that Google AdWords is awesome? You may be surprised to know that there are many additional ad networks out there with powerful audience targeting features. These platforms build comprehensive profiles of users on the internet. Through data, ad networks can identify who you want to reach.


If you’re a Houston-based doctor who is recruiting new patients, for instance, you can work with advertising solutions providers to reach prospective patients who have searched for conditions that align with your area of focus. The ability to connect with prospects that are already searching for your product, or service can give you a leg up against the competition.


 Blog about your customers’ interests

Content marketing is a powerful inbound marketing tool. By maintaining a blog, you’ll position your company as a thought leader and expert in your industry. If you want to attract visitors, what’s key is that you build editorial calendars, topic ideas, and keyword lists that are in complete alignment with your prospects’ areas of interest.

By selecting the right topics, you’ll give your brand the potential to achieve high rankings in organic search. For that reason, it’s in your best interest to learn the exact questions and search queries that your prospects are bringing to the table. Position your brand as a provider of compelling answers to your customers’ core needs.


 Partner with like-minded brands

Multi-headed beasts are inevitably smarter than single-headed beasts. There are similar companies trying to reach audiences like yours. Find out who these companies are, and instead of trying to beat them — join them in a consolidated, team effort.

Once you find a few complimentary partners, guest post on each other's blogs every few weeks, share each other's social media posts, or co-host a webinar. Find ways that your online efforts can work together to not only extend your reach, but also to bring more value to your collective target market. 


Provide relevant customer testimonials that speak to your target market

Your customer testimonials should connect with prospects on both a rational and emotional level. When visitors see your product for the first time, they are typically zeroing in on one key question — “what’s in it for me?”

You can simplify this mental process by providing a direct answer to this question. Show them examples of customers like themselves — social proof that underscores why your brand really is exceptional.

Ask individuals that you have worked with to provide a testimonial on your LinkedIn page, or to provide one that you can put on your website. If you really want to convey the value you provide, create customer testimonial videos.

1.6 CRM software tools are used for Data collection and reporting system that is capable of capturing the information required by the plan.

In CRM (customer relationship management), CRM software is a category of software that covers a broad set of applications and software designed to help businesses manage customer data and customer interaction, access business information, automate sales, marketing and customer support and also manage employee, vendor ...
eg: sage,


Sage

CRM software


Online CRM tools and self-hosted CRM software for all of your customer relationship management needs.

Easy, adaptable, affordable CRM for small and medium sized businesses, available in the cloud or on-premise. With Sage CRM, you can manage your entire contact base in one single place, track your leads to point of sale, and build better relationships with our range of campaign tools.  

Tuesday, June 7, 2016

Design Issues

Design Issues


Overview of formulas


Formulas are equations that perform calculations on values in your worksheet. A formula starts with an equal sign (=). For example, the following formula multiplies 2 by 3 and then adds 5 to the result.
=5+2*3
A formula can also contain any or all of the following: functions, references, operators, and constants.
Parts of a formula
Parts of a formula
1. Functions: The PI() function returns the value of pi: 3.142...
2. References: A2 returns the value in cell A2.
3. Constants: Numbers or text values entered directly into a formula, such as 2.
4. Operators: The ^ (caret) operator raises a number to a power, and the * (asterisk) operator multiplies.

In this article

Using constants in formulas

A constant is a value that is not calculated. For example, the date 10/9/2008, the number 210, and the text "Quarterly Earnings" are all constants. An expression, or a value resulting from an expression, is not a constant. If you use constant values in the formula instead of references to the cells (for example, =30+70+110), the result changes only if you modify the formula yourself.

Using calculation operators in formulas

Operators specify the type of calculation that you want to perform on the elements of a formula. There is a default order in which calculations occur, but you can change this order by using parentheses.

Types of operators

There are four different types of calculation operators: arithmetic, comparison, text concatenation, and reference.

Arithmetic operators

To perform basic mathematical operations such as addition, subtraction, or multiplication; combine numbers; and produce numeric results, use the following arithmetic operators.
Arithmetic Operator
Meaning
Example
+ (plus sign)
Addition
3+3
– (minus sign)
Subtraction
Negation
3–1
–1
* (asterisk)
Multiplication
3*3
/ (forward slash)
Division
3/3
% (percent sign)
Percent
20%
^ (caret)
Exponentiation)
3^2

Comparison operators

You can compare two values with the following operators. When two values are compared by using these oper
Comparison Operator
Meaning
Example
= (equal sign)
Equal to
A1=B1
> (greater than sign)
Greater than
A1>B1
< (less than sign)
Less than
A1<B1
>= (greater than or equal to sign)
Greater than or equal to
A1>=B1
<= (less than or equal to sign)
Less than or equal to
A1<=B1
<> (not equal to sign)
Not equal to
A1<>B1
ators, the result is a logical value either TRUE or FALSE.

Text concatenation operator

Use the ampersand (&) to join, or concatenate, one or more text strings to produce a single piece of text.
Text Operator
Meaning
Example
& (ampersand)
Connects, or concatenates, two values to produce one continuous text value
"North"&"wind"

Reference operators

Combine ranges of cells for calculations with the following operators.
Reference Operator
Meaning
Example
: (colon)
Range operator, which produces one reference to all the cells between two references, including the two references
B5:B15
, (comma)
Union operator, which combines multiple references into one reference
SUM(B5:B15,D5:D15)
(space)
Intersection operator, which produces on reference to cells common to the two references
B7:D7 C6:C8

The order in which Excel performs operations in formulas

In some cases, the order in which calculation is performed can affect the return value of the formula, so it's important to understand how the order is determined and how you can change the order to obtain desired results.

Calculation order

Formulas calculate values in a specific order. A formula in Excel always begins with an equal sign (=). The equal sign tells Excel that the succeeding characters constitute a formula. Following the equal sign are the elements to be calculated (the operands), which are separated by calculation operators. Excel calculates the formula from left to right, according to a specific order for each operator in the formula.

Operator precedence

If you combine several operators in a single formula, Excel performs the operations in the order shown in the following table. If a formula contains operators with the same precedence — for example, if a formula contains both a multiplication and division operator — Excel evaluates the operators from left to right.
Operator
Description
: (colon)
(single space)
, (comma)
Reference operators
Negation (as in –1)
%
Percent
^
Exponentiation
* and /
Multiplication and division
+ and –
Addition and subtraction
&
Connects two strings of text (concatenation)
=
< >
<=
>=
<>
Comparison

Use of parentheses

To change the order of evaluation, enclose in parentheses the part of the formula to be calculated first. For example, the following formula produces 11 because Excel calculates multiplication before addition. The formula multiplies 2 by 3 and then adds 5 to the result.
=5+2*3
In contrast, if you use parentheses to change the syntax, Excel adds 5 and 2 together and then multiplies the result by 3 to produce 21.
=(5+2)*3
In the example below, the parentheses around the first part of the formula force Excel to calculate B4+25 first and then divide the result by the sum of the values in cells D5, E5, and F5.
=(B4+25)/SUM(D5:F5)

Using functions and nested functions in formulas

Functions are predefined formulas that perform calculations by using specific values, called arguments, in a particular order, or structure. Functions can be used to perform simple or complex calculations.

The syntax of functions

The following example of the ROUND function rounding off a number in cell A10 illustrates the syntax of a function.
Structure of a function
1. Structure. The structure of a function begins with an equal sign (=), followed by the function name, an opening parenthesis, the arguments for the function separated by commas, and a closing parenthesis.
2. Function name. For a list of available functions, click a cell and press SHIFT+F3.
3. Arguments. Arguments can be numbers, text, logical values such as TRUE or FALSE, arrays, error values such as #N/A, or cell references. The argument you designate must produce a valid value for that argument. Arguments can also be constants, formulas, or other functions.
4. Argument tooltip. A tooltip with the syntax and arguments appears as you type the function. For example, type =ROUND( and the tooltip appears. Tooltips only appear for built-in functions.

Entering functions

When you create a formula that contains a function, the Insert Function dialog box helps you enter worksheet functions. As you enter a function into the formula, the Insert Function dialog box displays the name of the function, each of its arguments, a description of the function and each argument, the current result of the function, and the current result of the entire formula.
To make it easier to create and edit formulas and minimize typing and syntax errors, use formula autocomplete. After you type an = (equal sign) and beginning letters or a display trigger, Microsoft Office Excel displays below the cell a dynamic drop down list of valid functions, arguments, and names that match the letters or trigger. You can then insert an item in the drop-down list into the formula.

Nesting functions

In certain cases, you may need to use a function as one of the arguments of another function. For example, the following formula uses a nested AVERAGE function and compares the result with the value 50.
Nested functions
1. The AVERAGE and SUM functions are nested within the IF function.
Valid returns     When a nested function is used as an argument, it must return the same type of value that the argument uses. For example, if the argument returns a TRUE or FALSE value, then the nested function must return a TRUE or FALSE. If it doesn't, Microsoft Excel displays a #VALUE! error value.
Nesting level limits     A formula can contain up to seven levels of nested functions. When Function B is used as an argument in Function A, Function B is a second-level function. For instance, the AVERAGE function and the SUM function are both second-level functions because they are arguments of the IF function. A function nested within the AVERAGE function would be a third-level function, and so on.

Using references in formulas

A reference identifies a cell or a range of cells on a worksheet and tells Microsoft Excel where to look for the values or data you want to use in a formula. With references, you can use data contained in different parts of a worksheet in one formula or use the value from one cell in several formulas. You can also refer to cells on other sheets in the same workbook, and to other workbooks. References to cells in other workbooks are called links or external references.

The A1 reference style

The default reference style     By default, Excel uses the A1 reference style, which refers to columns with letters (A through XFD, for a total of 16,384 columns) and refers to rows with numbers (1 through 1,048,576). These letters and numbers are called row and column headings. To refer to a cell, enter the column letter followed by the row number. For example, B2 refers to the cell at the intersection of column B and row 2.
To Refer To
Use
The cell in column A and row 10
A10
The range of cells in column A and rows 10 through 20
A10:A20
The range of cells in row 15 and columns B through E
B15:E15
All cells in row 5
5:5
All cells in rows 5 through 10
5:10
All cells in column H
H:H
All cells in columns H through J
H:J
The range of cells in columns A through E and rows 10 through 20
A10:E20
Making a reference to another worksheet     In the following example, the AVERAGE worksheet function calculates the average value for the range B1:B10 on the worksheet named Marketing in the same workbook.
Sheet reference example
Reference to a range of cells on another worksheet in the same workbook
1. Refers to the worksheet named Marketing
2. Refers to the range of cells between B1 and B10, inclusively
3. Separates the worksheet reference from the cell range reference

The difference between absolute, relative and mixed references

Relative references     A relative cell reference in a formula, such as A1, is based on the relative position of the cell that contains the formula and the cell the reference refers to. If the position of the cell that contains the formula changes, the reference is changed. If you copy or fill the formula across rows or down columns, the reference automatically adjusts. By default, new formulas use relative references. For example, if you copy or fill a relative reference in cell B2 to cell B3, it automatically adjusts from =A1 to =A2.
Copied formula with relative reference
Absolute references     An absolute cell reference in a formula, such as $A$1, always refer to a cell in a specific location. If the position of the cell that contains the formula changes, the absolute reference remains the same. If you copy or fill the formula across rows or down columns, the absolute reference does not adjust. By default, new formulas use relative references, and you may need to switch them to absolute references. For example, if you copy or fill an absolute reference in cell B2 to cell B3, it stays the same in both cells =$A$1.
Copied formula with absolute reference
Mixed references     A mixed reference has either an absolute column and relative row, or absolute row and relative column. An absolute column reference takes the form $A1, $B1, and so on. An absolute row reference takes the form A$1, B$1, and so on. If the position of the cell that contains the formula changes, the relative reference is changed, and the absolute reference does not change. If you copy or fill the formula across rows or down columns, the relative reference automatically adjusts, and the absolute reference does not adjust. For example, if you copy or fill a mixed reference from cell A2 to B3, it adjusts from =A$1 to =B$1.
Copied formula with mixed reference

The 3-D reference style

Conveniently referencing multiple worksheets    If you want to analyze data in the same cell or range of cells on multiple worksheets within the workbook, use a 3-D reference. A 3-D reference includes the cell or range reference, preceded by a range of worksheet names. Excel uses any worksheets stored between the starting and ending names of the reference. For example, =SUM(Sheet2:Sheet13!B5) adds all the values contained in cell B5 on all the worksheets between and including Sheet 2 and Sheet 13.
  • You can use 3-D references to refer to cells on other sheets, to define names, and to create formulas by using the following functions: SUM, AVERAGE, AVERAGEA, COUNT, COUNTA, MAX, MAXA, MIN, MINA, PRODUCT, STDEV, STDEVA, STDEVP, STDEVPA, VAR, VARA, VARP, and VARPA.
  • 3-D references cannot be used in array formulas.
  • 3-D references cannot be used with the intersection operator (a single space) or in formulas that use implicit intersection.
What happens when you move, copy, insert, or delete worksheets     The following examples explain what happens when you move, copy, insert, or delete worksheets that are included in a 3-D reference. The examples use the formula =SUM(Sheet2:Sheet6!A2:A5) to add cells A2 through A5 on worksheets 2 through 6.
  • Insert or copy     If you insert or copy sheets between Sheet2 and Sheet6 (the endpoints in this example), Microsoft Excel includes all values in cells A2 through A5 from the added sheets in the calculations.
  • Delete     If you delete sheets between Sheet2 and Sheet6, Excel removes their values from the calculation.
  • Move     If you move sheets from between Sheet2 and Sheet6 to a location outside the referenced sheet range, Excel removes their values from the calculation.
  • Move an endpoint     If you move Sheet2 or Sheet6 to another location in the same workbook, Excel adjusts the calculation to accommodate the new range of sheets between them.
  • Delete an endpoint     If you delete Sheet2 or Sheet6, Excel adjusts the calculation to accommodate the range of sheets between them.

The R1C1 reference style

You can also use a reference style where both the rows and the columns on the worksheet are numbered. The R1C1 reference style is useful for computing row and column positions in macros. In the R1C1 style, Excel indicates the location of a cell with an "R" followed by a row number and a "C" followed by a column number.
Reference
Meaning
R[-2]C
A relative reference to the cell two rows up and in the same column
R[2]C[2]
A relative reference to the cell two rows down and two columns to the right
R2C2
An absolute reference to the cell in the second row and in the second column
R[-1]
A relative reference to the entire row above the active cell
R
An absolute reference to the current row
When you record a macro, Excel records some commands by using the R1C1 reference style. For example, if you record a command such as clicking the AutoSum button to insert a formula that adds a range of cells, Excel records the formula by using R1C1 style, not A1 style, references.
You can turn the R1C1 reference style on or off by setting or clearing the R1C1 reference style check box under the Working with formulas section in the Formulas category of the Excel Settings dialog box that you display from the Microsoft Office Button Office button image.

Using names in formulas

You can create defined names to represent cells, ranges of cells, formulas, constant values, or Excel tables. A name is a meaningful shorthand that makes it easier to understand the purpose of a cell reference, constant, formula, or table, each of which may be difficult to comprehend at first glance. The following information shows common examples of names and how they can improve clarity and understanding.
Example Type
Example With No Name
Example With A Name
Reference
=SUM(C20:C30)
=SUM(FirstQuarterSales)
Constant
=PRODUCT(A5,8.3)
=PRODUCT(Price,WASalesTax)
Formula
=SUM(VLOOKUP(A1,B1:F20,5,FALSE), —G5)
=SUM(Inventory_Level,—Order_Amt)
Table
C4:G36
=TopSales06

Types of names

There are several types of names you can create and use.
Defined name     A name that represents a cell, range of cells, formula, or constant value. You can create your own defined name, and Excel sometimes creates a defined name for you, such as when you set a print area.
Table name     A name for an Excel table, which is a collection of data about a particular subject that is stored in records (rows) and fields (columns). Excel creates a default Excel table name of "Table1", "Table2", and so on, each time you insert an Excel table, but you can change the name to make it more meaningful. For more information on Excel tables, see Using structured references with Excel tables.

Creating and entering names

You create a name by using the:
  • Name box on the formula bar     This is best used for creating a workbook level name for a selected range.
  • Create a name from selection    You can conveniently create names from existing row and column labels by using a selection of cells in the worksheet.
  • New Name dialog box     This is best used for when you want more flexibility in creating names, such as specifying a local worksheet level scope or creating a name comment.
NOTE: By default, names use absolute cell references.
You can enter a name by:
  • Typing     Typing the name, for example, as an argument to a formula.
  • Using Formula AutoComplete     Use the Formula AutoComplete drop-down list, where valid names are automatically listed for you.
  • Selecting from the Use in Formula command    Select a defined name from a list available from the Use in Formulacommand in the Defined Names group on the Formula tab.
For more information, see Use names to clarify formulas.


Using array formulas and array constants

An array formula can perform multiple calculations and then return either a single result or multiple results. Array formulas act on two or more sets of values known as array arguments. Each array argument must have the same number of rows and columns. You create array formulas in the same way that you create other formulas, except you press CTRL+SHIFT+ENTER to enter the formula. Some of the built-in functions are array formulas, and must be entered as arrays to get the correct results.
Array constants can be used in place of references when you don't want to enter each constant value in a separate cell on the worksheet.

Using an array formula to calculate single and multiple results

When you enter an array formula, Microsoft Excel automatically inserts the formula between { } (braces).
To calculate a single result     This type of array formula can simplify a worksheet model by replacing several different formulas with a single array formula.
For example, the following calculates the total value of an array of stock prices and shares, without using a row of cells to calculate and display the individual values for each stock.
Array formula that produces a single result
When you enter the formula ={SUM(B2:D2*B3:D3)} as an array formula, it multiples the Shares and Price for each stock, and then adds the results of those calculations together.
To calculate multiple results     Some worksheet functions return arrays of values, or require an array of values as an argument. To calculate multiple results with an array formula, you must enter the array into a range of cells that has the same number of rows and columns as the array arguments.
For example, given a series of three sales figures (in column B) for a series of three months (in column A), the TREND function determines the straight-line values for the sales figures. To display all of the results of the formula, it is entered into three cells in column C (C1:C3).
Array formula that produces multiple results
When you enter the formula =TREND(B1:B3,A1:A3) as an array formula, it produces three separate results (22196, 17079, and 11962), based on the three sales figures and the three months.

Using array constants

In an ordinary formula, you can enter a reference to a cell containing a value, or the value itself, also called a constant. Similarly, in an array formula you can enter a reference to an array, or enter the array of values contained within the cells, also called an array constant. Array formulas accept constants in the same way that nonarray formulas do, but you must enter the array constants in a certain format.
Array constants can contain numbers, text, logical values such as TRUE or FALSE, or error values such as #N/A. Different types of values can be in the same array constant — for example, {1,3,4;TRUE,FALSE,TRUE}. Numbers in array constants can be in integer, decimal, or scientific format. Text must be enclosed in double quotation marks — for example, "Tuesday".
Array constants cannot contain cell references, columns or rows of unequal length, formulas, or the special characters $ (dollar sign), parentheses, or % (percent sign).
When you format array constants, make sure you:
  • Enclose them in braces ( { } ).
  • Separate values in different columns with commas (,). For example, to represent the values 10, 20, 30, and 40, enter {10,20,30,40}. This array constant is known as a 1-by-4 array and is equivalent to a 1-row-by-4-column reference.
  • Separate values in different rows with semicolons (;). For example, to represent the values 10, 20, 30, and 40 in one row and 50, 60, 70, and 80 in the row immediately below, you would enter a 2-by-4 array constant: {10,20,30,40;50,60,70,80}.

Featured Post

Computers in Art Practice:Manfred Mohr

Artist Manfred Mohr Since 1969, Manfred Mohr has used computers and plotters as electronic and digital drawing aids, thus making inevita...